目次
何するの?
CentOS8環境でDjangoチュートリアルのModels.pyをER図として出力します。
出力には、django-extensionsのgraph-modelsを使用します。
環境
- CentOS Linux release 8.2.2004 (Core)
- Python 3.8.5
- django 3.0.5
作成対象のプロジェクトの作成
Django公式チュートリアルを使用
https://docs.djangoproject.com/ja/3.1/intro/tutorial01/
実際は↓の手順で作成したものを流用
出力に必要な設定を整える
CentOS
sudo dnf install -y graphviz
sudo dnf --enablerepo=PowerTools install -y graphviz-devel
Python(Django)
pip install django-extensions
pip install pygraphviz
settings.py
INSTALLED_APPS = [
  ...
    'django_extensions',
  ...
]
ER図を出力
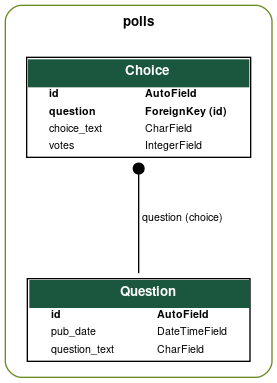
Pollsアプリ関連のER図を出力
python manage.py graph_models -g -o erd_polls.png polls
出力結果
プロジェクト全体のER図を出力
python mysite/manage.py graph_models -a -g -o erd_project.png
出力結果

コマンドのオプションやその他の用途はこちらを参照
https://django-extensions.readthedocs.io/en/latest/graph_models.html
参考
https://django-extensions.readthedocs.io/en/latest/graph_models.html